史密斯圆图:一段历史,以及为何它对射频工程师如此重要
DigiKey 科普长文:史密斯圆图的由来、它如何把无穷的阻抗空间映射到一个单位圆内、以及为何它在 80 多年后仍是射频设计的核心工具。英文原文逐字 + 中文深度解读。
原文:The Smith Chart: Its History and Why It’s So Important for RF Designers 作者:Bill Schweber(电子工程师,著有三本电子通信系统教材,曾任 EDN 执行编辑与模拟编辑) 来源:DigiKey TechForum Blog,发布于 2021-07-29 本文为「英文原文 + 中文深度解读」对照版。原文完整公开,无付费墙。
Part 1 · 英文原文(逐字)
The Smith Chart: Its History and Why It’s So Important for RF Designers
By: Bill Schweber · 2021-07-29
Novice designers doing RF design and trying to make a direct connection between two components—for example, from a voltage-controlled oscillator (VCO) to a mixer—have undoubtedly come across strange, circular graphs on component data sheets, such as these for the Maxim Integrated MAX2472, a 500-to-2500 megahertz (MHz) VCO buffer amplifier (Figure 1). These graphs, called Smith charts, are very different than anything seen in algebra or statistics classes, no doubt of that.
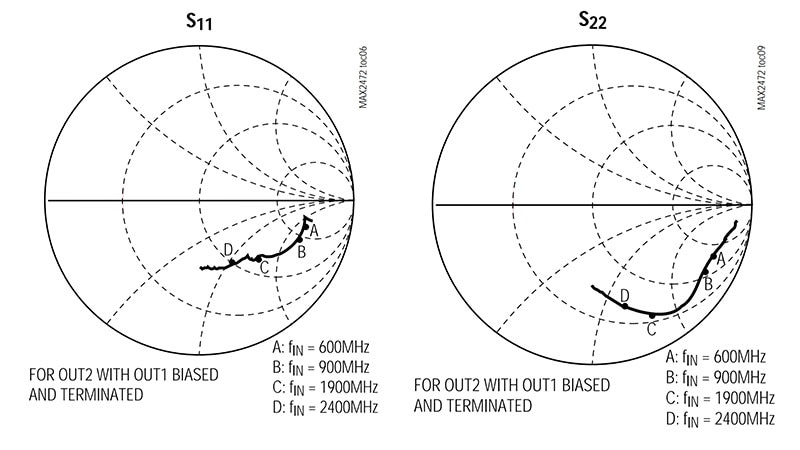
The chart is named for Phillip Smith, an engineer at Bell Telephone Laboratories, who devised and refined it between 1936 and 1939 while working on understanding transmission lines and standing waves at what was then considered “high frequencies” of up to 1 MHz (called megacycles per second in those days). His strange-looking circular chart has become the single most useful and powerful tool for working with and optimizing high-frequency circuits with respect to their input and output impedance, even in our age of powerful computers and computer-aided design (CAD) tools.
Among its many uses, the Smith chart provides an efficient way to visualize design options when trying to match interstage source and load impedances, a very important consideration in many circuits, especially RF design. There are two reasons such matching is critical:
• First, to realize maximum power transfer from a source to a load, the source’s complex impedance R_S + jX_S must equal the complex conjugate R_L - jX_L of the load impedance:

Where R is the resistive (real) part of the impedance and X is the reactive (inductive or capacitive) part (Figure 2).

- Second, even if such power loss is not a concern (although it almost always is), impedance matching is needed to minimize the reflection of energy from the load back to the source, which can damage the source’s output circuitry.
What the Smith chart shows
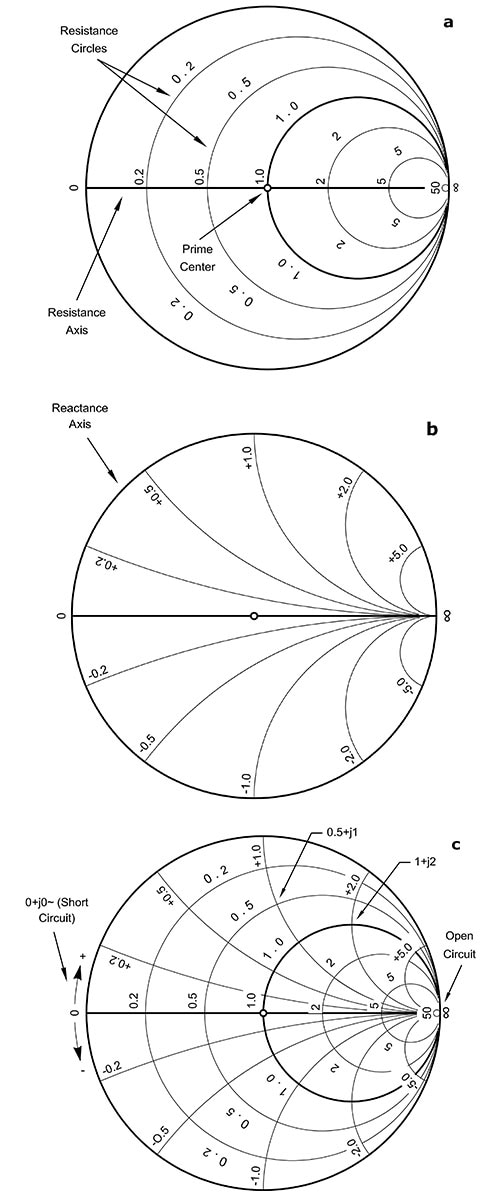
The Smith chart is a polar plot of the complex reflection coefficient (also called gamma and symbolized by rho (Γ)). It succeeds at displaying what may seem at first to be an almost impossible task: the simultaneous graphing of the real and imaginary parts of a complex impedance, where the real part R can range from 0 to infinity (∞) and the imaginary part X can span minus infinity to plus infinity—and do so all on a single sheet of paper.
A simplified Smith chart, showing its circles of constant resistance and arcs of constant reactance, is a good starting point to understanding its arrangement (Figure 3). As an added benefit, the chart also provides a way to show scattering parameters (s-parameters) and how their values relate to actual hardware measurements and considerations.
Once these complex impedance values are marked on the Smith chart, the chart can be used to identify many parameters which are critical to understanding the RF signal path or transmission line situation including:
- Complex voltage and current reflection coefficients.
- Complex voltage and current transmission coefficients.
- Power reflection and transmission coefficients.
- Reflection loss.
- Return loss.
- Standing wave loss factor.
- Maximum and minimum voltage and current, as well as standing wave ratio (SWR).
- Shape, position, and phase distribution along with voltage and current standing wave.
But that’s only a part of the power of the Smith chart. While it is useful and often necessary for designers to know the above parameters, the Smith chart can guide analysis and design decisions including:
- Display of complex impedances versus frequency.
- Display of s-parameters of a network versus frequency.
- Evaluation of input reactance or susceptance of open and shorted stubs.
- Evaluation of effects of shunt and series impedances on the impedance of a transmission line.
- For displaying and evaluating the input impedance characteristics of resonant and anti-resonant stubs, including the bandwidth and Q.
- Designing impedance-matching networks using single or multiple open or shorted stubs, quarter-wave line sections, and lumped L-C components.
The benefits of the Smith chart
At first glance, the standard, fully detailed Smith chart may look like a nearly incomprehensible jumble of lines going in all directions (Figure 4), but it is really just a higher-resolution, more detailed rendering of the simplified chart previously shown. You can download a printable version of a Smith chart from the resources in the online DigiKey Innovation Handbook.

The Smith chart shows more than just a single solution to many design-related problems: it shows the many possible solutions. Designers can then decide which ones offer suitable sets of component values for the specific situation, such as practical values for impedance-matching inductors and capacitors. In most cases, the chart’s number scales are “normalized” to 50 ohm (Ω) systems, as this is the most common impedance used in RF design.
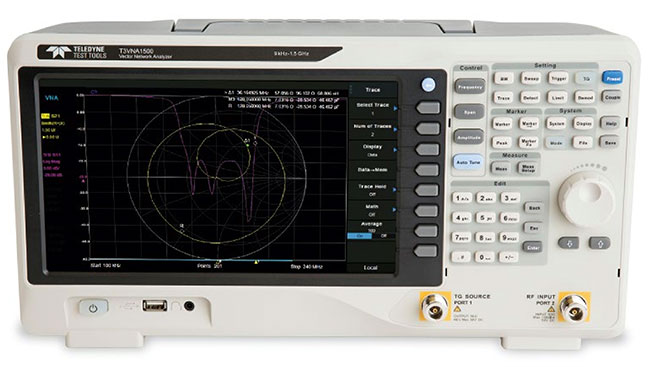
The Smith chart is so important and useful that many test instruments for RF and microwave applications, such as vector network analyzers (VNAs), can chart and display it. For example, the Teledyne LeCroy T3VNA VNA offers such a mode (Figure 5).
How hard is it to learn to use the Smith chart? As with most such questions, it’s the same as asking different students how they feel about the difficulties of calculus or electromagnetic field theory: it depends. There are many online text and video tutorials that start with Smith chart basics then add transmission line equations and analytical perspectives. They also go through numerous examples for using it. Of course, there are also apps and programs which ease graphing, framing the problem, and evaluating options using the Smith chart. However, it helps to first understand the chart basics before resorting to these.
Conclusion
It’s amazing that a graphical tool developed over 80 years ago, long before RF design as we now know it even existed, is still one of the key resources for both paper and software-based RF design challenges. Used either way, the Smith chart is a powerful tool for displaying and assessing RF parameters, and gaining insight into design alternatives and their associated tradeoffs. The best way to learn about the power of the Smith chart and what it can do for you is to use it and work through some of the many published examples.
Recommended Reading
- “The Smith Chart: An ‘Ancient’ Graphical Tool Still Vital in RF Design” — digikey.com
- “SAW Filters Rescue Wireless Products from Impractical Discrete Implementations” — digikey.com
- “Understanding the Basics of Low-Noise and Power Amplifiers in Wireless Designs” — digikey.com
- “Use Log Amps to Enhance Sensitivity and Performance in Wide-Dynamic-Range RF and Optical Links” — digikey.com
About this author

Bill Schweber is an electronics engineer who has written three textbooks on electronic communications systems, as well as hundreds of technical articles, opinion columns, and product features. In past roles, he worked as a technical web-site manager for multiple topic-specific sites for EE Times, as well as both the Executive Editor and Analog Editor at EDN.
Part 2 · 中文深度解读
核心论点
史密斯圆图(Smith Chart)是 1930 年代末贝尔实验室工程师 Phillip Smith 发明的一种图形化阻抗工具。它的反直觉之处在于:把理论上”实部 0→∞、虚部 −∞→+∞”的整个复阻抗平面,映射到一个单位圆之内。八十年后,在 CAD 与矢量网络分析仪(VNA)横行的时代,它仍是射频/高速设计中不可替代的”直觉界面”——既能在纸上手算,也能直接作为现代仪器的显示模式。
关键概念
- 反射系数 Γ(gamma / rho):圆图的横纵坐标本质是复反射系数。阻抗匹配的目标,就是让负载端的 Γ 趋近原点(匹配点,50 Ω 归一化后为圆心)。
- 恒定电阻圆 + 恒定电抗弧:圆图由两组曲线叠加而成——等电阻的圆(R 恒定)与等电抗的弧(X 恒定)。沿圆移动改变 R,沿弧移动改变 X。
- 归一化到 50 Ω:绝大多数射频系统以 50 Ω 为参考,圆图刻度即按 50 Ω 归一化,便于直接读值。
- 共轭匹配(Conjugate Matching):最大功率传输的条件是源阻抗 Z_S = R_S + jX_S 等于负载阻抗的共轭 Z_L* = R_L − jX_L。原文 Figure 2 即表达这一关系。
- 一组可一眼读出的量:SWR(驻波比)、回波损耗(Return Loss)、反射/传输系数、沿线电压电流驻波分布与相位——这些在普通笛卡尔坐标里极难同时呈现,在圆图上却”一次画完”。
技术拆解:为什么是”圆”而不是别的
射频设计的核心矛盾是阻抗匹配:不匹配 → 功率传不过去 + 能量反射回来可能烧毁源端输出级。阻抗本身是复数且范围无界,普通的直角坐标图要么画不下无穷,要么把 50 Ω 附近最关心的区域压成一个点。
Smith 的巧思是用双线性变换(从阻抗平面到反射系数平面)把整个右半复平面(R≥0)保角映射进单位圆:
- 实部 R=0(纯电抗)落在圆周上;R=∞ 收缩为圆图最右端的单点(开路点)。
- 虚部 ±jX 表现为圆周上的弧;X=0(纯电阻)落在水平中轴线上。
- 因此”所有实际阻抗”都被优雅地装进一张纸,且 50 Ω 附近被放大、便于精细读数。
原文强调它的”非唯一解”价值:给定源与负载,圆图上画出的是一族可行匹配路径(集总 L-C、单/多节开路/短路短截线、四分之一波长线等),工程师再按可实现的器件值挑一条——这是纯粹数值仿真很难直观给到的”设计空间感”。
与本站系列的交叉链接
- SerDes / CPO 系列:224/448 Gbps SerDes 与 CPO 光互连的本质,是极高频率下的信道与阻抗匹配问题。封装内走线、连接器、光器件每一级的回波损耗(Return Loss)与 SWR 都直接决定误码率;圆图正是评估这些匹配与反射的图形母语。可读:SerDes 技术全景(上篇)、Pushing the Speed Limit:SerDes 收发器 224/448Gbps 架构拆解。
- 光子时代系列:当铜链路被光替代,射频/微波的”匹配与反射”思维迁移到光波导耦合损耗与回波上,底层工程直觉一脉相承。可读:光子时代正在到来。
- Sivers Semiconductors:其 RF 前端(波束成形 IC、毫米波模块)的设计流程里,VNA + 圆图是日常调试负载匹配的标准动作。可读:Sivers Semiconductors 公司剖析。
延伸阅读(原文 Recommended Reading)
- The Smith Chart: An ‘Ancient’ Graphical Tool Still Vital in RF Design
- SAW Filters Rescue Wireless Products from Impractical Discrete Implementations
- Understanding the Basics of Low-Noise and Power Amplifiers in Wireless Designs
- Use Log Amps to Enhance Sensitivity and Performance in Wide-Dynamic-Range RF and Optical Links
标签:射频 · 科普 · Smith-chart · 阻抗匹配 · 传输线。本文仅作技术科普与翻译整理,不构成任何投资建议。